Feeds:
Posts
Comments

Archive for the ‘U.S. stocks’ Category

Friday 04/18/08

  • Asia – Look at the inverted head n shoulders on FXI
  • Europe – Great Britain giving out pounds – look for institutional traders to step in
  • US – James look into the Financial futures crystal ball and tell me what you see?
  • James how do I trade the financials and the JPY?
  • $ up and commodities down.why??? – Interest rates may not fall as much as the market had been pricing in?
  • $CRX.X what does that tell us, POT,MON, EOG, PCU, IWM -UYM
  • Look at commodities/ w JPY
  • FX Pup Lesson on Stochastics
  • Have a great weekend

Audio commentary Link

Read Full Post »

Tuesday 04/15/08

  • To quote from Andrew Busch, currency strategist for BMO Capital Markets: Happy Tax Day! Most likely, this will be the lowest tax rate you will be paying for the rest of your life…….
  • AUD rally then retracement overnight on rumors and then spends the rest of the nigh selling off
  • $CRX.X, GLD, SLV, OIL make the commodity picture increasingly more bullish based off of demand – $ gets whacked
  • UK housing meets up with Browns Approval ratings and gets sold
  • EUR rallies on Poor German News?
  • SKF – Up but CHF and JPY still not selling off??
  • US PPI and what that means for CPI tomorrow? Want to see commodities follow through to get long Commodity equities and currencies
  • FX pups postponed, James Boyd is MIA

Audio Commentary Link

Read Full Post »

The Federal Reserve moved today to add liquidity to the markets by announcing a series of actions with other central banks to help improve liquidity and lending for the markets. The Fed are taking this coordinated action without cutting interest rates due in part of rising inflation. US markets showed instant gratification in pre-market trading. and the Dollar rose in strength. The EUR/USD reversed an earlier move 150 pip run up right after the announcement. The USD/JPY ran up 120 pips after the announcements. With all this good news, the bulls may be back for the dollar.

This coordinated effort with the other central banks is being excepted very well with the ECB because it falls in line with what they are trying to achieve. Time will tell if it is a good move for the US markets and other markets around the world.

~G

Read Full Post »

dow.jpg Stocks got a HUGE “denied” today as they failed to overcome former support/now resistance (was the old head and shoulders neckline) and came down forcibly from it. See the green oval on the lefthand chart.


eurusd-triangle.jpg This is a classic “retest”, having broken out from a technical level. What does it mean for the pairs? In my book it’s a big signal to get frisky again with the yen and franc, and back to be careful/be bearish with the more aggressive currencies such as the euro. Look at how the EUR/USD has come down hard from the resistance we’ve been watching.

This is also a good example of how intermarket analysis can help in currency trading. Disclaimer: if you are starting out, don’t think you have to know all this and do it! You can do fine without. But I’ve found it helpful to me as I’ve adavnced over the years.

dowvolume.jpg Stocks have the bonus of having volume attached to their prices. Rising volume supports price movement, falling volume weakens it. We can put volume on DIA (mirrors the dow, and has volume on it) and see a picture of the bears being strong and the bulls being weak (see chart on left). As we see this unfolding, it helps us feel more bearish and bullish of certain pairs because stocks continue to lead currencies in a lot of ways.

Bottom line: as stocks continue downward, so will most pairs, and the yen and franc will strengthen!

Read Full Post »

eurusdtnx.jpg So the EUR/USD super trend has stalled. Will it regain its pace?

It’s in murky waters. The dollar is, without a doubt, weak. Evidence is seen on $TNX – as it falls, 10 years yields (rates) are falling, which hurts the buck. And the buck is already hurting.

In the chart, notice how as EUR/USD rises (USD is falling) $TNX falls. Falling rates/rate prospects coincide with dollar weakness. In the green bars, the two prices diverge and we expect EUR/USD to correct bullishly according to the still dropping $TNX. In the red bar we’d expect EUR/USD to correct bearishly because $TNX was rising – alas, though, it was counter trend and the $TNX up-blip didn’t stick. Beside, at that point euro bullishness dominated.

With $TNX still heading firmly lower, the dollar still has an anchor tied around its ankle. The question is whether the euro can oblige, or if this stock stuff spooks it too much and economic worries make the pair choppy. It wouldn’t be surprising.

If US stock weakness continues (it could continue for a long while), and if EUR/USD stays in a funk, you could participate in USD weakness via USD/CHF. Again, it goes back to following your rules vis a vis the charts, and this economic/fundamentals thinking helps point you in the right direction so you know which charts to focus on, and to see the chart changes coming.

Read Full Post »

stocks.jpg Shocking and unsurprisingly stocks went down in a heavy bone-crunching thud today! Bam! We’ve seen this coming for months, talked about it here, fundamentals have been getting nasty in the US (hi, financials, thanks mortgage/real estate) and it showed up as a long term double top on the US indexes (see S&P500 chart beside this) and now a gigantic break below support today.

Wasn’t this what we were looking out for on Monday? 🙂

istock_000003880585xsmall.jpg This has all sorts of implications for currencies, the least of which are “unwinds” in carry trades involving the yen and franc. So the strategy is real, real simple here: if you haven’t already look for trades involving these as they continue to strengthen. And enjoy raking in the pips.

Once again, stocks lead most currencies (the counterparts of the yen and franc in the carry trades) most of the time except at important turning points like the last couple of days.

Read Full Post »

gbpjpy8.jpg After the carnage in stocks today (more later), the GBP/JPY is eyeing the downside again. If you traded the pair on the hourly chart, you were stopped out in the last few days. But oh, what a run! And if you gave back too much in gains, time to devise an exit strategy that captures more of the move.

And so I present … the GBP/JPY hourly triple top! Ta-da! Notice where I drew support (“neckline”) to breakout from, and the green oval target below, which by the way, happens to be at another support level: the turning point bottom.

Most other crosses have remained in the dumps, it’s the pound that’s shown some strength. But the fundamentals of the pound remain week, and some short term strength is nothing to be excited about. It’s born out technically in the trend on the daily chart. As we get into the Asian session tonight, I’d like to see the break of this triple top as Asian investors jaws’ drop from seeing the damage in US stocks and their own follow suit.

Read Full Post »

dogsmall.jpg     Look at stocks go! Pull up $SPX on the daily chart. Man they just shot off today, didn’t they? We were talking about stocks a few posts ago – looks like they found it within themselves to break bullishly out of the micro consolidation they were in. I doesn’t look like much on the daily chart, but I smelled some nice order to it and going to an hourly chart ah-ha! We find a very clear flag pattern.

    That’s what I look for in flags: unusually strong vertical moves before the consolidation, a nice orderly consolidation in a trapezoidal shape, then a strong break. Welcome back, uptrend! (on the daily chart, it’s looking like higher highs/lows are resuming) This is a good thing for all you carry bulls out there. Look at how most of the currencies which pay decent interest are reacting.

stocks1.jpg

Read Full Post »

Jim Rogers is a bit odd (sorry Jim) in some ways, but a pretty sharp crayon when it comes to the markets. First off, I apologize about the crappy quality of this video, I think someone filmed their TV, yuck. But, it is timely since it is from yesterday, and he has some pretty interesting things to say about the markets. He also admits he is “horrible” at market timing, so fear not if you have some trades that have gone bad and think you’ll “never make it”!

This discussion started when some of us coaches emailed about Jim. A month ago Jim said he was selling USD, but with this caveat toward the end of an interview:

If anything, if I were a good trader, I would probably buy the dollar, because it’s probably going to have a rally. But when it rallies, I would suggest you get out of dollars.

And sure enough, Edward Goettig (one of the coaches) said Jim said yesterday that he is buying dollars, until the dollar stops rallying whereupon he’ll sell them again. I totally agree with his posture and have been thinking the same thing. Anyway, the interview:

Read Full Post »

As currencies continue to take their queue from stocks – albeit a bit less lately –  it’s interesting to see how stocks have popped in the last several days.

I like to watch the S$P500 ($SPX), and it keeps it simple for me to just watch this index. The price indeed popped up last week, but did not make a higher high (to my eyes it came a bit short), so the downtrend for stocks seems to have held on. What is interesting is that stocks popped thru resistance, but there is a parallel one above it catching them. I highlighted this area in a red oval below. You would expect them to keep falling lower now, but this may be a flag shaped consolidation and I’m watching to see if the S&P can pop out of this resistance area. The implication would be positive for most currencies.

This is a good illustration, by the way, of how an extreme jab thru support/resistance (in this case, resistance back around the start of November) can end up being a second trench of resistance, which runs parallel to the first.

stocks.jpg

Read Full Post »

don_kohn.jpg    The Fed (VP Donald Kohn) said today that they would be using


“(these uncertainties require) flexible and pragmatic policymaking — nimble is the adjective I used a few weeks ago.”

and carry trades got a shot in the arm as stocks jumped – no matter that durable goods and housing data came in wimpy, all is well apparently(!)

    The test will be if good fundamental (economic) news comes in to support this. Investors shall not live on rate cuts alone.

    Read the whole thing here if you are bored tonight and can’t sleep.

Read Full Post »

danger_of_death.gif     We have to keep keeping an eye on stocks. The S&P500 ($SPX) just broke below its rising support level, which is nasty enough. Now the next level to watch out for is definitely the horizontal support below, which would make this out to be a double top. Remember, stocks going down coincide with currency yuckiness.

    I did want to point out that stocks bottomed in August and they are trying to poke lower than that level right now on a closing basis. But that day in August also had a big jab lower. Both are important. But since the jab lower coincides with a couple other lows (see the blue line on the chart below), it makes a better, more pertinent support. Besides, if you call the closing price for that August day the support, you’re being risky not taking into account the full price action, which got much lower.

stocks4.jpg

Read Full Post »

    If you’re not keeping an eye on stocks, please do. Most, if not all, of the support and resistance areas in the different pairs right now are driven by stocks. Think of $SPX as a pure form of averaged out support or resistance for currencies right now.

Stocks AND most currencies continue to be weighed down by worries over risk. This may reach a breaking point as stocks are back at resistance! So right now we’re sitting on pins and needles.

stocks3.jpg

Read Full Post »

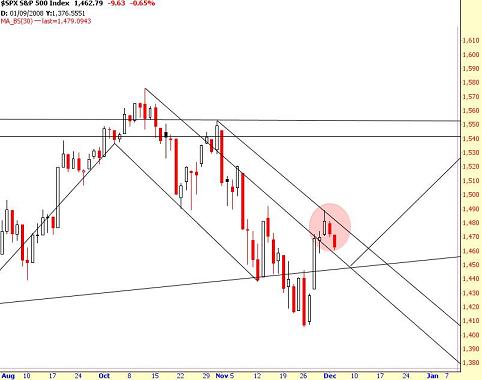
    Stocks aren’t getting much of a bounce from support this time around. I have them pegged in a channel downward. A break in support below (red bubble) will drive most currencies, such as the carry, down down down. A break higher through the channel resistance (green bubble) will give them breathing room until hitting the major resistance again. In a sense, looking at this is like looking at an average of most currencies, and averaging out the significant support and resistance levels.

stocks2.jpg

    The two choices we see clearly in front of me reminds me of one of my favorite poems – here I get a bit wistful. It’s a pretty popular poem, I’m not a literary guru but I do know the well-known stuff and I love this. Robert Frost’s “Road Less Traveled”.

Two roads diverged in a yellow wood,
And sorry I could not travel both
And be one traveler, long I stood
And looked down one as far as I could
To where it bent in the undergrowth;


Then took the other, as just as fair,
And having perhaps the better claim,
Because it was grassy and wanted wear;
Though as for that the passing there
Had worn them really about the same,


And both that morning equally lay
In leaves no step had trodden back.
Oh, I kept the first for another day!
Yet knowing how way leads on to way,
I doubted if I should ever come back.


I shall be telling this with a sigh
Somewhere ages and ages hence:
Two roads diverged in a wood, and I-
I took the one less traveled by,
And that has made all the difference.

Read Full Post »

Heads up, stocks are at a long term support level. What’s at stake? Life as we know it. If we crack below, then we challenge the last low which, over the long term on the weekly chart, defines the long term trend. Yikes. Note that stocks are heavily oversold, which correlates to carry being oversold. Expect a reprieve here while they catch their breath.

stocks1.jpg

Speaking of life as we know it, check out the World Clock which one of the coach’s brought to my attention. Wow! Click and go there to see how quickly life and death stuff is happening on the planet. Interesting stuff.

worldclock.jpg

Read Full Post »

Older Posts »