Feeds:
Posts
Comments

Archive for the ‘British pound’ Category

A lesson on trading with the stochastic indicator on the GBP/JPY by:  James ‘Big Dog’ Boyd.

The stochastic is a great tool to monitor the trade to see how much room we have left to go up or down. The stochastic again tells us the bullish or bearish sentiment in the trade. In this example we look at both bearish and bullish examples on the GBP/JPY.

GBP/JPY Chart #1

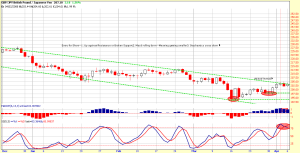
Caption #1: 1- GBP/JPY short at a diagonal level of resistance on April 6th. 2 – MACD confirms rollover, stochastics crosses to the downside. 3 – GBP/JPY pair selling off at resistance.  Indicator Settings: MACD Hist setting = 6,13,9 and Slow Stochastics setting = 5,3.

GBP/JPY Chart #2

Caption #2: GBP/JPY confirms a stochastic “pinch” after 5 days (April 13th).  Once the stochastic pinches we have 2 options… 1) Exit the trade.  2) Make sure the stop is appropriate.

When the stochastic is oversold, buyers in this case buy the GBP/JPY.

 ***KEY*** Watch the width between the 2 lines of the stochastic. When the GBP/JPY falls, monitor the trade by looking at the separation between the stochastics (you may have not hit your stop loss at this point). If the 2 lines are still apart they have potentially some room to drop. If they pinch, BULLS are buying the GBP/JPY back. If that’s the case, invoke # 2.

GBP/JPY Chart #3

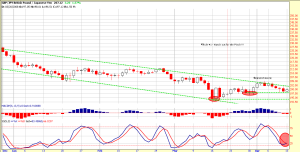
Caption #3: GBP/JPY confirms that it is going to hold the higher low. Stochastic crosses back up representing that bulls are coming back into the trade.

If the stochastic cross back down, you have a greater chance in getting stopped out.

REMEMBER, when the stochastic pinches like in photo #2, we have 2 options — 1) Exit the trade 2) Make sure the stop is appropriate.


Read Full Post »

Friday 04/18/08

  • Asia – Look at the inverted head n shoulders on FXI
  • Europe – Great Britain giving out pounds – look for institutional traders to step in
  • US – James look into the Financial futures crystal ball and tell me what you see?
  • James how do I trade the financials and the JPY?
  • $ up and commodities down.why??? – Interest rates may not fall as much as the market had been pricing in?
  • $CRX.X what does that tell us, POT,MON, EOG, PCU, IWM -UYM
  • Look at commodities/ w JPY
  • FX Pup Lesson on Stochastics
  • Have a great weekend

Audio commentary Link

Read Full Post »

Tuesday 04/15/08

  • To quote from Andrew Busch, currency strategist for BMO Capital Markets: Happy Tax Day! Most likely, this will be the lowest tax rate you will be paying for the rest of your life…….
  • AUD rally then retracement overnight on rumors and then spends the rest of the nigh selling off
  • $CRX.X, GLD, SLV, OIL make the commodity picture increasingly more bullish based off of demand – $ gets whacked
  • UK housing meets up with Browns Approval ratings and gets sold
  • EUR rallies on Poor German News?
  • SKF – Up but CHF and JPY still not selling off??
  • US PPI and what that means for CPI tomorrow? Want to see commodities follow through to get long Commodity equities and currencies
  • FX pups postponed, James Boyd is MIA

Audio Commentary Link

Read Full Post »

gbpjpy1.jpg The pair finally broke from its triangle – down, as I long expected. Freaking heck that took long enough. Usually went it goes sideways for a good while it breaks out and acts like a teenager with long pent-up energy – it goes bananas. I circled previous times like this in the last several months. It should be good for a good many hundreds of pips so enjoy the ride!

Read Full Post »

fishjump.jpg Remember we were talking about the EUR/GBP last week, and the stair-step pattern that is especially evident with the Bollinger Bands? Well the pair closed above the upper band yesterday. So let’s say we got in and let the experiment begin.

This really isn’t a “paper” trade – we don’t have many clearly defined rules, etc. – but we are doing this for several reasons. We noticed a pattern in the pair and want to see this thru to an extent and watch what happens if we participate in it, having seen it ahead of time. We are learning more about Bollinger Bands. We get to test how we would consider exiting based on the pattern’s past. We get to fool around with different exit options.

eurgbp1.jpg

For example, let’s say we want to have an emergency exit. There’s all sorts of ways to do a stop loss, but for simplicity’s sake of choosing one we’ll say we get out if the pair goes below the low of the day before the entry day’s candle. That’s 0.7475 so we’ll say 0.7465. We’ll worry about topside exits later as it gets going (like I said, quite different from how a paper trade would be…)

Read Full Post »

eurgbp.jpg I’ve fooled around plenty with Bollinger Bands, but they aren’t part of my regular trading routine. Nonetheless, I often poke my nose around what various things are up to, and notice a nice pattern on EUR/GBP.

The trend is up, and the bands have been stair-stepping up. It’s a great pattern, with the bands being at a support/resistance area (I drew my own lines that I felt were a bit more accurate). And it’s a pattern that seems soon due for another step up.

The last 3 times the break in resistance was signaled by a close above the band. There’s a lot of BBands traders who love this kind of stuff. Personally I think the best method would be to use that close above the band accompanied with a buy signal in whatever your method is.

Let’s see where this goes. We’ll try a little experiment with the ol’ bands and see what happens after the next close above the top band. And remember – our saving grace as traders is commitment to a method, or system. It’s understandable if you are still learning what the indicators do. But that should be a short road. The longer road that gets you somewhere is using one of them a lot. You start out not that great with it, but get better and better and that’s where profits lie.

Read Full Post »

gbpjpy.jpg Looks like we are getting a bounce lower off a small resistance level on the GBP/JPY, unsurprisingly. All is well with the downtrend.

Read Full Post »

copy-of-bouncesmaller.jpg We’ve talked about it – all hail the Koruna, right? Still doing its thing. On the left, below is the chart as I’ve had it drawn out for months now. I thought it might help some to see how I made a subtle change to my chart to account for some recent price action.

gbpczk1.jpg Sometimes when a pair is in a channel (parallel support and resistance) it will run another more subtle, parallel support/or resistance within it. As price bounces between the channel lines, it’ll pull back only about halfway and then go back again. You’ll see what I mean by this other chart on the left with the extra line added in the middle of the channel.

gbpczknew.jpg Anyway, it is what the pair is doing now, and the whole point is that if you missed an entry recently, like when it bounced down from resistance, this affords you another chance to sell into the bounce.


(Green ovals mark how the mid-line in the channel developed by rejecting the price. Notice it may now become resistance and we may be in a new, down-shifted channel)

Read Full Post »

Well, here’s to a new week! An excellent way to start out is spending a moment on the “big picture.”

comp.jpg Technically the euro remains strong, the pound and loonie weak, and the yen has been gaining strength. The comparison chart on the left illustrates this nicely.

Fundamentally nothing has changed – there is trouble, and trouble isn’t swept away under the rung from the Fed popping up one day and slashing rates. A great article by George Soros on the trouble we’re talking about is right here.

stocks1.jpg US stocks, which continue to influence currencies, aren’t looking any rosier. Perhaps the best things to do is to be prepared for volatility while the markets sort themselves out. Trade a little less, trade smaller positions, maybe a bit shorter term. And remember that if we get choppy, that often the market gets like that – the amazing trends we’ve seen across the board lately have been exceptional!

Read Full Post »

gbpjpy8.jpg After the carnage in stocks today (more later), the GBP/JPY is eyeing the downside again. If you traded the pair on the hourly chart, you were stopped out in the last few days. But oh, what a run! And if you gave back too much in gains, time to devise an exit strategy that captures more of the move.

And so I present … the GBP/JPY hourly triple top! Ta-da! Notice where I drew support (“neckline”) to breakout from, and the green oval target below, which by the way, happens to be at another support level: the turning point bottom.

Most other crosses have remained in the dumps, it’s the pound that’s shown some strength. But the fundamentals of the pound remain week, and some short term strength is nothing to be excited about. It’s born out technically in the trend on the daily chart. As we get into the Asian session tonight, I’d like to see the break of this triple top as Asian investors jaws’ drop from seeing the damage in US stocks and their own follow suit.

Read Full Post »

intrmarket.jpg Today is the first day I look at the S&P500 ($SPX) – representing the average of US stocks – and think “this may be a pennant”. If I can get a triangle shape out of short term support and resistance, it’s a pennant. And price coiling like this at support is pretty threatening to that support. Not good for stocks.

Interestingly, I found myself thinking of the GBP/JPY which already broke lower. US stocks may be a bit of a “barometer” for other markets, but smart money often leads in other markets, such as currencies. Looking at the GBP/JPY works just fine because it is a major carry pair. The carry trade is a canary in the market mine: it is very sensitive to global economic changes..

leadership.jpgIt’s a negative feedback cycle. Odds of stocks breaking lower increase with the pennant coiling at support, and the break lower already of GBP/JPY. If stocks do break, this will fuel GBP/JPY further.

* By the way, I don’t say this enough, but if you’re new to trading do not feel like you have to know all of this! All different people read this blog, and the intent is education. I find things like this intermarket analysis business give me a little edge here and there in trading. The great bulk, though, is mastering a trading style by sticking with certain rules consistently. Then you add little stuff like this. Keep reading things like this with your “observer’s cap” on and it gradually sinks in.

Read Full Post »

We’ve been talking about these so don’t forget about them, these are 3 great trending pairs that are entrenched in money-making mode (in the direction of the arrow on the chart, I made it clear if it wasn’t obvious), so simply look for signals to get in – don’t just get in any ol’ time – and enjoy!

eurusd.jpg EUR/USD: bullish – broke out of a flag type of pattern, I can see this getting up to 1.60. Doing as expected.


gbpczk.jpg GBP/CZK: bearish – it’s gone 2,000 pips down since we talked about its bearishness in December.


gbpjpy7.jpg GBP/JPY: bearish – we’ve been beating this horse lately. It broke down from a long term head and shoulders.

Read Full Post »

gbpjpy6.jpg Remember 213.50, how we talked about how a breach lower than this point would resume the bearishness? The pair has been flopping around above that for a week but in the wee hours it broke lower. Finally, dang it.

If you missed it or are not in yet, fear not. It is doing a typical retest of that level from beneath, trying it out as resistance now. It should hold. Remember, our whole premise is that the pair has broken a head and shoulders on the daily chart and it’s looking nasty.

I was going to clean my lines up last night but notice how I have lines all over from last week. They are irrelevant now because they were short term and we’ve moved beyond them. Illl erase them now, all but the thick horizontal line which is not resistance.

Read Full Post »

shaysworthy1.jpg Today in the daily audio FX we break down the essentials of the Bank geeks testimonies to tradeable action and information. We discuss the intermarket relationships of pumping liquidity into the U.S. markets, did the BOE really hold rates – do you need more reason to short the GBP? China – the latest government that thinks they can fix commodity prices, which historically speaking spells disaster.

Read Full Post »

gbpjpy5.jpgKeeping an eye on this trade is a great example of how you can sometimes see things coming. Notice how we are coming up on a convergence of support. Notice that puts us around tomorrow morning … what’s happening then? Bank of England interest rate statementECB interest rate statement. GBP trade balance. WOW.

Obviously my bias is for this news to be negative and pop the GBP/JPY lower. I have that bias from the pair’s trend, from the recent price pattern breakout, from reading the consistently bad economic news out there.  Think of it as like: if the pair sits at support, odds favor a break lower. We’ll see what happens, but this is a big, a ways ahead, heads-up.

Read Full Post »

Older Posts »